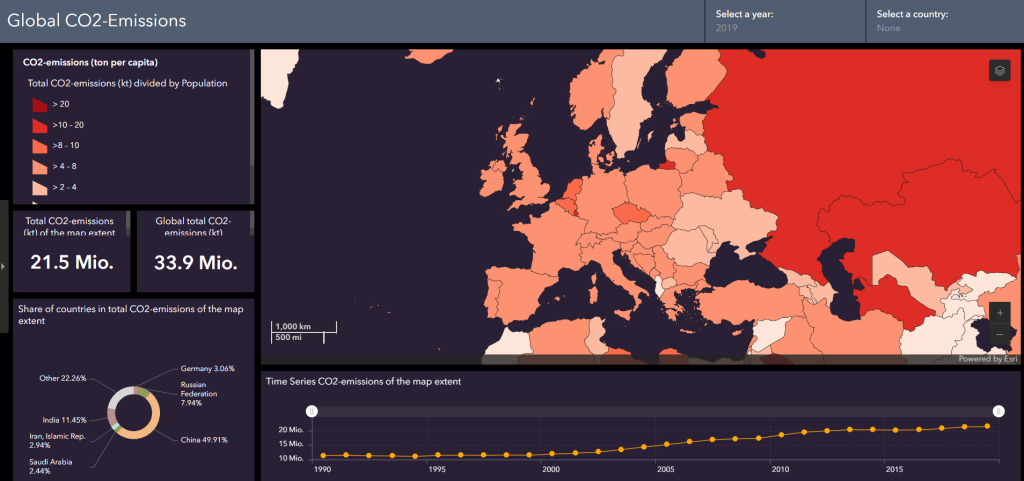
Geovisualization: Creating a Dashboard to inform about Global CO2-emissions
Keywords: advanced cartography, geovisualization, CO2 emissions, dashboard, target audience, interactiveness.
Summary: Cartography and map creation is an integral skill for the geospatial domain. Here, an interactive dashboard was created for school kids using ArcGIS Online. It shows global CO2-emissions in an interactive way as the data changes according to the map extent and filter possibities. The dashboard can be accessed on the original website (here). If ArcGIS request you to login, click on “Cancel” a few times. In addition, a story map was made, explaining the process and the individual steps of the dashboard creation in detail (here).
Software: ArcGIS Pro, Python, MS Excel, ArcGIS Dashboards, ArcGIS Story Maps,
